ML-Powered Problem Detection in Chameleon
Hello! My name is Syed Mohammad Qasim, a PhD candidate at the Department of Electrical and Computer Engineering, Boston University. This summer I worked on the project ML-Powered Problem Detection in Chameleon as part of the Summer of Reproducibility (SoR) program with the mentorship of Ayse Coskun and Michael Sherman.
Chameleon is an open testbed that has supported over 5,000 users working on more than 500 projects.
It provides access to over 538 bare metal nodes across various sites, offering approximately 15,000 CPU cores and 5 petabytes of storage.
Each site runs independent OpenStack services to deliver its offerings.
Currently, Chameleon Cloud comprehensively monitors the sites at the Texas Advanced Computing Center (TACC) and the University of Chicago.
Metrics are collected using Prometheus at each site and fed into a central Mimir cluster.
All logs are sent to a central Loki, with Grafana used for visualization and alerting.
Chameleon currently collects around 3,000 metrics. Manually reviewing and setting alerts for them is time-consuming and labor-intensive.
This project aims to help Chameleon operators monitor their systems more effectively and improve overall reliability by creating an anomaly detection service to augment the existing alerting framework.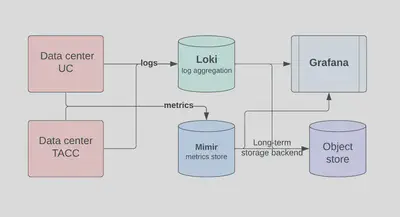
Over the summer, we focused on analyzing the data and identified 33 key metrics, after discussions with Chameleon operators, from the Prometheus Node Exporter that serve as leading indicators of resource usage on the nodes. For example:
- CPU usage: Metrics like node_load1, node_load5, and node_load15.
- Memory usage: Including buffer utilization.
- Disk usage: Metrics for I/O time, and read/write byte rates.
- Network activity: Rate of bytes received and transmitted.
- Filesystem metrics: Such as inode_utilization_ratio and node_procs_blocked.
- System-level metrics: Including node forks, context switches, and interrupts.
Collected at a rate of every 5 minutes, these metrics provide a comprehensive view of node performance and resource consumption. After finalizing the metrics we wanted to monitor, we selected the following four anomaly detection methods, primarily due to their popularity in academia and recent publication in high-impact conferences such as SIG-KDD and SC.
- Omni Anomaly, [KDD 2019] [without POT selection as it requires labels.]
- USAD, [KDD 2020]
- TranAD, [KDD 2022]
- Prodigy, [SC 2023] [Only the VAE, not using their feature selection as it requires labels.]
We collected 75 days of healthy data from Chameleon, and after applying min-max scaling, we trained the models. We then used these models to run inference on the metrics collected during outages, as marked by Chameleon operators. The goal was to determine whether the outage data revealed something interesting or anomalous. We can verify our approach by manually reviewing the results generated by these four anomaly detection methods. Below are the results from the four methods on different outages, followed by an example of how these methods identified the root cause of an anomaly.
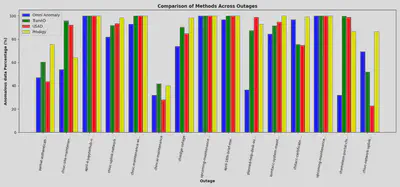
The above figure shows the percentage of outage data that was flagged as anomalous by different models.
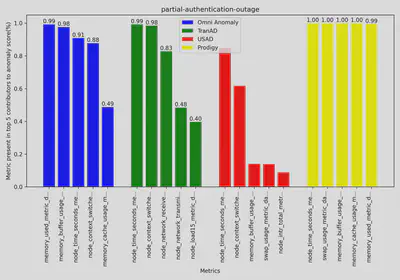
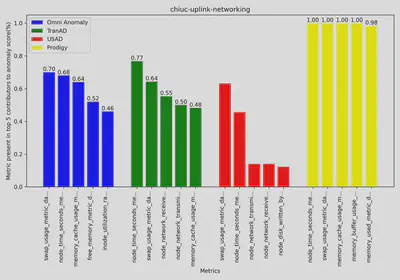
The above two plots shows two examples of the top 5 metrics which contributed to the anomaly score by each anomaly detection model.
Although the methods seem to indicate anomalies during outages, they are not able to pinpoint the affected service or the exact cause. For example, the first partial authentication outage was due to a DNS error, which can manifest in various ways, such as reduced CPU, memory, or network usage. This work is still in progress, and we are conducting the same analysis on container-level metrics for each service, allowing us to narrow the scope to the affected service and more effectively identify the root cause of anomalies. We will share the next set of results soon.
Thanks for your time, please feel free to reach out to me for any details or questions.
Syed Mohammad Qasim
PhD Candidate at Boston University
Syed Mohammad Qasim is a PhD student specializing in performance debugging and anomaly detection in cloud computing environments.