Midterm Update: Dynamic Catalog, Equations, and Browser-Side CSV Export for ENTS
Halfway through GSoC 2026: progress, challenges, and what’s next
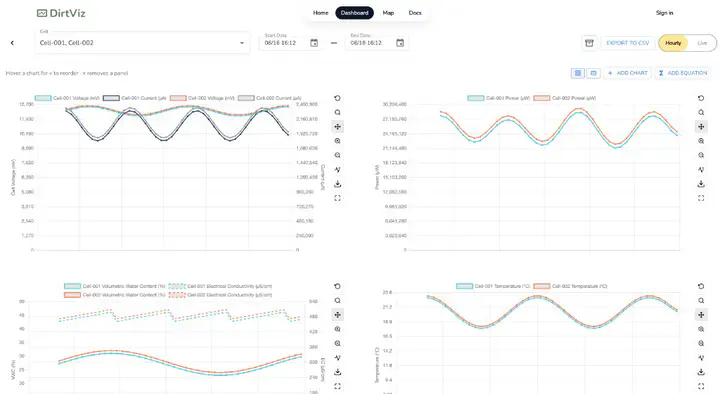 DirtViz dashboard with customizable chart panels
Hi again! I’m Mehbub (GitHub), and this is my midterm update for Environmental NeTworked Sensor I under Google Summer of Code 2026 / OSRE with UC OSPO. I’m working with Colleen Josephson, John Madden, and Alec Levy on ENTS-backend (DirtViz).
If you haven’t seen it yet, my introductory blog covers the project goals and background. You can also find my proposal here.
Project Recap
DirtViz helps researchers plot environmental sensor data in the field. My summer goal is to make the dashboard grow with the database instead of with hardcoded React chart lists: discover what a cell can plot, let users arrange panels and share layouts via URL, support simple derived equations, and export the data they can already see.
Progress So Far
Catalog-driven panels and shareable layouts
Early work focused on treating the backend catalog as the source of truth for what can be charted, and keeping layouts in the URL so a view is shareable without a server-side saved-layout system. That foundation made later features much easier. Once panels had stable IDs and a central historical fetch, equations and CSV could plug into the same pipeline.
Derived equation panels (PR #780, merged)
Users can add expressions like 1:vwc / 1:temp, validate them on the server, and plot derived series next to the built-in charts. Mentors emphasized not inventing a mini language in the browser alone. Strict server-side validation keeps bad expressions from becoming silent chart bugs.
DB-driven sensor discovery (PR #795, merged)
This was a classic “it works in pgAdmin but not in DirtViz” bug. The catalog used to scan a hardcoded _UNIFIED_SPECS list, so sensors that were ingested fine (name, measurement, and unit already in the sensor table) never appeared as chartable panels.
The fix was to discover panels from real sensor rows that have data, emit s:{sensorId} panel IDs, and teach the frontend layout and charts how to render them. That matches the project thesis from week one: the UI should ask the database what exists, not hope a frontend dictionary is complete.
CSV export from loaded chart data (PR #797, open)
Export used to be a Celery job that rebuilt CSV on the server (pandas merge, poll /api/status, sometimes download the literal string Pending...). In production it could even OOM the API workers (see #468 and #668).
After discussing with mentors, we flipped the model: export whatever is already plotted. The browser serializes the historical caches the dashboard already fetched, with three header rows (name / unit / type), timestamp-aligned columns, and NAN for gaps. That moves the heavy lift off limited worker threads and scales with users instead of Celery concurrency.
Follow-up work on that PR (in progress from mentor review) includes removing the unused backend export stack (Celery, Valkey, and worker containers), covering large and misaligned series with reproducible tests, and including #795’s s: panels in the export.
Challenges and Learnings
Most of the hard problems this half were about fit and process, not only writing UI code.
Charts and CSV used to be two different data paths. Charts were already doing the right thing (Postgres resamples; the frontend mostly plots). CSV paid again by merging in memory on the server, and sometimes worse. The midterm lesson for me: when the product says “export what you see,” reuse the chart cache instead of inventing another backend job.
Issue #792 looked like “missing charts,” but the data was already there. Debugging that forced a clearer boundary between legacy power/TEROS tables and the generic sensor table.
Open source contribution also involves a lot of process: Codecov patch gates, lint formatters, deploy-to-dev workflows, and careful habits around main. Mentor feedback on #797 reminded me that deleting dead infrastructure (workers, env vars, docs) is part of finishing a feature, not an optional cleanup pass.
Communication mattered too. Standing up work in Zulip and GitHub early, especially for the CSV approach, saved weeks of building the wrong backend stream. Async updates before meetings made the live calls much more useful.
What’s Next
For the second half of the summer, I plan to:
- Finish the CSV review TODOs on #797 and get export fully landed
- Tighten edge cases around DB sensor panels and layout share links
- Polish documentation and reproducible local demos for mentors and future contributors
- Leave stretch items (richer equation UX, optional saved layouts) clearly marked if time runs short
Closing Thoughts
Halfway through the summer, DirtViz already feels closer to the dashboard I described in my proposal: discoverable sensors, shareable layouts, equations, and an export path that is kinder to the API. I’m grateful to John and Alec for their design feedback, especially the push to keep CSV in the browser, and to UC OSPO / OSRE / GSoC for the chance to do this work in the open.
I’m excited for the second half of the project and looking forward to sharing more in the final blog. Stay tuned!
Mehbub
Indie Hacker · Full Stack Engineer
Mehbub is an indie hacker and full stack engineer from India, working across React, Next.js, TypeScript, Node.js, Python, PostgreSQL, and cloud-native tooling.